


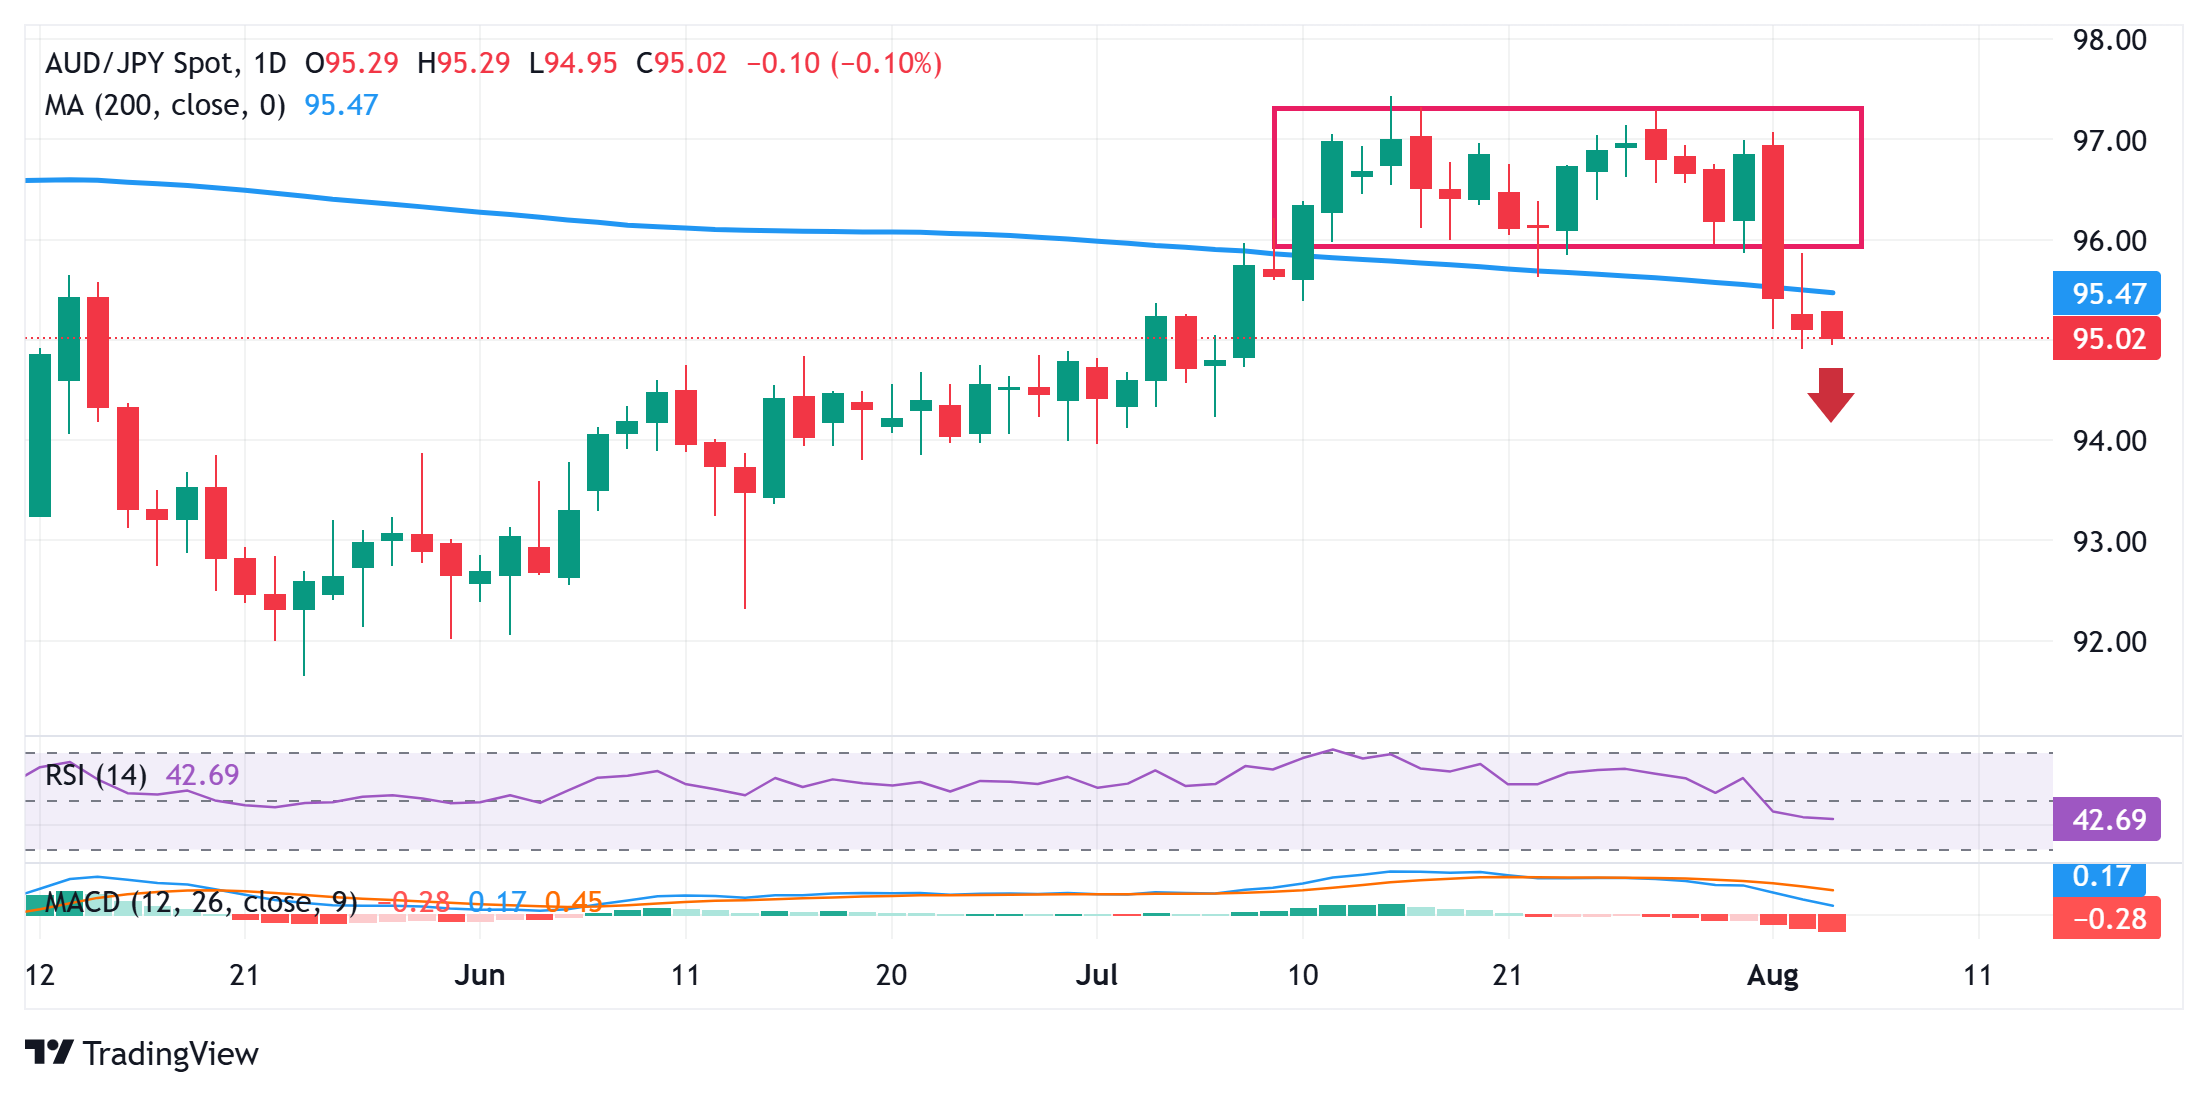
AUD/JPY Price Forecast: Bears await acceptance below 95.00; 200-day SMA breakdown in play
- AUD/JPY struggles to lure buyers and seems vulnerable to extend the recent corrective decline.
- Acceptance below the trading range support and the 200-day SMA validates the negative outlook.
- Any attempted recovery could be seen as a selling opportunity and is likely to remain capped.
The AUD/JPY cross struggles to capitalize on its modest Asian session uptick and languishes near the 95.00 psychological mark, close to a nearly four-week low touched the previous day. Moreover, the technical setup suggests that the path of least resistance for spot prices is to the downside.
Friday's breakdown through the 96.00 round figure, representing the lower boundary of a nearly three-week-old trading range, and subsequent weakness below the 200-day Simple Moving Average (SMA) was seen as a key trigger for the AUD/JPY bears. Moreover, oscillators on the daily chart have just started gaining negative traction and validate the near-term negative outlook.
Bears, however, might wait for acceptance below the 95.00 mark before positioning for an extension of the recent pullback from a multi-month peak touched in July. The AUD/JPY cross might then accelerate the corrective fall towards the 94.75 intermediate support en route to the 94.35 region before extending the decline further towards retesting sub-94.00 levels in the near-term.
On the flip side, the 200-day SMA, currently pegged near the 95.45 region, now seems to act as an immediate hurdle ahead of the trading range support breakpoint, just ahead of the 96.00 mark. The latter should act as a strong barrier, which, if cleared, might trigger a short-covering rally and lift the AUD/JPY cross to the 96.50 horizontal resistance en route to the 96.75-96.80 region.
AUD/JPY daily chart
Australian Dollar PRICE Today
The table below shows the percentage change of Australian Dollar (AUD) against listed major currencies today. Australian Dollar was the strongest against the New Zealand Dollar.
| USD | EUR | GBP | JPY | CAD | AUD | NZD | CHF | |
|---|---|---|---|---|---|---|---|---|
| USD | 0.13% | 0.05% | 0.03% | 0.10% | 0.23% | 0.37% | 0.27% | |
| EUR | -0.13% | -0.09% | -0.10% | -0.03% | 0.01% | 0.17% | 0.14% | |
| GBP | -0.05% | 0.09% | -0.04% | 0.06% | 0.11% | 0.25% | 0.10% | |
| JPY | -0.03% | 0.10% | 0.04% | 0.07% | 0.28% | 0.32% | 0.23% | |
| CAD | -0.10% | 0.03% | -0.06% | -0.07% | 0.08% | 0.20% | 0.04% | |
| AUD | -0.23% | -0.01% | -0.11% | -0.28% | -0.08% | 0.19% | 0.00% | |
| NZD | -0.37% | -0.17% | -0.25% | -0.32% | -0.20% | -0.19% | -0.08% | |
| CHF | -0.27% | -0.14% | -0.10% | -0.23% | -0.04% | -0.00% | 0.08% |
The heat map shows percentage changes of major currencies against each other. The base currency is picked from the left column, while the quote currency is picked from the top row. For example, if you pick the Australian Dollar from the left column and move along the horizontal line to the US Dollar, the percentage change displayed in the box will represent AUD (base)/USD (quote).